
Top Creators in the USA
InstMe keeps a live ranking of creators in the USA across platforms, drawn from an index of millions of profiles across several social networks. The typical account here averages 204.3K followers with a 7.48% engagement rate — real numbers from our monitoring pipeline, not a directory that quietly goes stale.
One thing worth knowing before you scroll: 85% of the creators in this segment are nano or micro accounts (under 100K followers), the tier where engagement runs warmest and collaborations cost the least. Shortlist a few names below, then open any profile for its full free report: growth trend, audience quality, benchmarks and estimated media value.
Millions
Profiles indexed across networks
204.3K
Avg. followers
7.48%
Avg. engagement
71%
Recently active
34.4%
Verified accounts
Top 21 creators
Ranked by followers
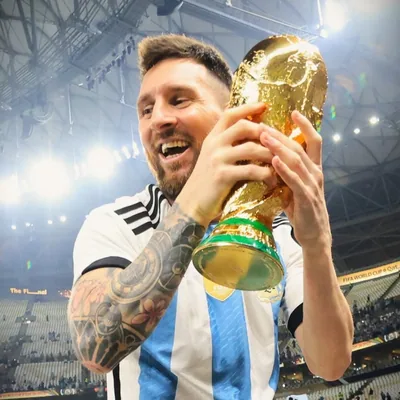
Leo Messi
@leomessi
515.6M
1.0% ER
Nike
@nike
291.8M
0.3% ER
Jennifer Lopez
@jlo
240.6M
0.1% ER
Katrina Kaif
@katrinakaif
80M
3.4% ER
Justin Timberlake
@justintimberlake
71.4M
0.2% ER
Shawn Mendes
@shawnmendes
70.2M
1.0% ER
AnushkaSharma1588
@anushkasharma
67.4M
7.5% ER
ZARA
@zara
62.4M
0.0% ER

Chris Hemsworth
@chrishemsworth
57.9M
0.4% ER
HUDA BEAUTY
@hudabeauty
56.1M
0.1% ER
Louis Vuitton
@louisvuitton
55.2M
0.0% ER

National Geographic Travel
@natgeotravel
44.6M
0.0% ER
President Donald J. Trump
@realdonaldtrump
44.1M
0.5% ER
Netflix US
@netflix
42.3M
0.1% ER
Pubity
@pubity
42.1M
0.9% ER
H&M
@hm
38M
0.0% ER
Instant Bollywood
@instantbollywood
37.5M
0.1% ER

apple
@apple
36.8M
0.2% ER
Beast Reacts
Beast Reacts
36.6M
0.0% ER
WWE
@wwe
36.2M
0.3% ER
NFL
@nfl
33M
0.1% ER
This is just the top of the list — millions of profiles across several social networks
Sign up free to browse the full segment, filter by size, engagement and location, and export shortlists.
Unlock the full list — free
instme Top Creators in the USA — ranked live
About Creators in the USA
A feed-level view of U.S. creator content
A creator films a grocery run in Austin, cuts to a quick recipe in a small apartment kitchen, then posts a follow-up answering comments about cost, substitutions, and where to buy the pan. Another uploads a YouTube breakdown of a college football weekend, while a TikTok creator in Los Angeles tests a beauty product under natural light before a night out. U.S. creator content is not one category; it is a mix of lifestyle, entertainment, food, fitness, fashion, parenting, gaming, education, sports, beauty, travel, finance, and local culture.
The strongest archetypes often have a clear role in the audience’s day: the practical explainer, the taste-maker, the local guide, the entertainer, the niche expert, or the aspirational personality. Instagram is commonly used for polished visuals, Stories, Reels, product tagging, and community updates. TikTok is where fast hooks, trends, humor, and informal product discovery travel quickly. YouTube supports longer tutorials, reviews, routines, commentary, and searchable evergreen content.
Audiences come for usefulness as much as personality. They want recommendations, shortcuts, honest reactions, entertainment, identity, and a sense of what people in specific places or subcultures are doing now.
See how it stacks up next to top creators in Los Angeles and top creators on Instagram in the USA before you shortlist.
Campaign approaches that match U.S. creator behavior
Product-led storytelling works best when the placement fits the creator’s normal rhythm. A home organizer can integrate storage products into a closet reset. A fitness creator can show a training week rather than a single gym clip. A food creator can build a recipe around a packaged ingredient without turning the post into a static ad.
Common formats include short-form product demos, day-in-the-life integrations, GRWM content, unboxings, tutorials, comparison videos, affiliate posts, event coverage, giveaways, and longer YouTube reviews. For creators with strong community interaction, comment-led follow-ups can perform well because they show that the creator is listening. For visual categories such as beauty, fashion, travel, food, and home, before-and-after formats and routine-based content are often more persuasive than direct product claims.
Price is usually shaped by audience size, engagement quality, category, production effort, usage rights, exclusivity, timeline, platform mix, and whether the creator is expected to appear in paid media. Verified status can also affect perceived authority; in this segment, the verified share is 39.6%. Still, a large badge or follower count should not be treated as a substitute for audience fit. In InstMe aggregate data for U.S. creators, the average follower count is 373,300 and the average engagement rate is 6.84%, but individual performance can vary widely by niche and platform.
For briefs, pricing benchmarks and outreach templates, read our guide to creator marketing for your business.
Reading the numbers behind U.S. creator fit
The account-size mix matters because U.S. campaigns can be built in very different ways. Micro creators make up 44% of the segment and nano creators 37%, which often supports localized, niche, or community-led campaigns. Mid-size creators represent 12%, while macro and mega accounts account for 3% and 4% respectively; these are more relevant when reach, recognition, or broader cultural association is the main goal.
Engagement should be read in context. A smaller creator with consistent comments, saves, shares, and repeat viewers may be more useful than a larger account with passive reach. Look for evidence that followers understand the creator’s niche and respond to recommendations. On YouTube, watch time patterns, comment depth, and search relevance matter. On TikTok, completion, shares, and the ability to turn a trend into original content are important. On Instagram, saves, Story interactions, Reel performance, and comment quality can show whether the audience is attentive.
Red flags include sudden follower spikes without a content reason, repetitive or generic comments, heavy sponsored-post density, mismatched audience geography, low-quality disclosure practices, and content that changes style abruptly whenever a brand appears. Current trends favor candid testing, creator-led scripts, short educational clips, regional specificity, behind-the-scenes production, and multi-post narratives rather than one-off mentions. The best creator choices combine audience relevance, credible content habits, and a format the creator can execute naturally.
Skip the manual checks — InstMe's influencer search platform surfaces these signals automatically in every free report.
Market snapshot
How this segment breaks down by account size and platform — updated Sep 19, 2026.
Frequently asked questions
By city
Narrow it down
Charts for this market
Metric leaderboards for Instagram accounts in the USA — ranked by the numbers, refreshed daily.