
Top Business Bloggers
How does the market for business bloggers actually look? In short: the segment averages 130.3K followers at 10.08% engagement, and 75% of it is nano or micro accounts — the tier most brands lean on for authentic, budget-friendly collaborations. The data comes from InstMe's index of millions of profiles across several social networks.
Below you'll find the current top creators, a snapshot of how the segment splits by account size and platform, and answers to the questions brands ask us most. Everything refreshes automatically as our pipeline rescans profiles.
Millions
Profiles indexed across networks
130.3K
Avg. followers
10.08%
Avg. engagement
74%
Recently active
33.5%
Verified accounts
Top 21 creators
Ranked by followers

Mamiko
@mamikoyoko
2.6M
2.9% ER
LEENA
@leena_lifestyle
2.1M
16.7% ER

LEENA SNOUBAR
@withloveleena
1.5M
0.9% ER

Mochileando
@mochileandopr
1.1M
1.2% ER
Latifa Alshamsi
@latifalshamsi
844K
0.2% ER
عبدالله الجاسر
@3bodka
826.3K
1.2% ER

Азиза Мухтарова | Юмор • Лайфстайл • Рецепты • 🥨
@azizka.m
750.6K
0.7% ER
ELLE
@elleswift
649.2K
3.6% ER

Yaja Morelo
@yajamorelo
645.4K
7.0% ER
Lylo Fa
@lylocyv
528.3K
1.5% ER
Vanessa Loy-Mehri
@swahilifood
452.3K
14.9% ER
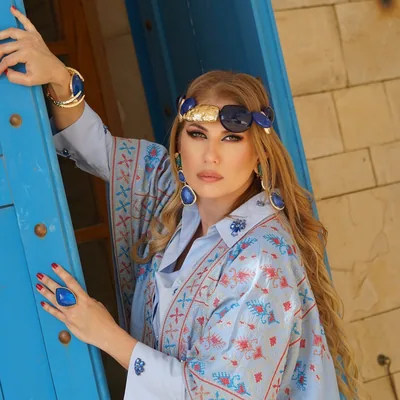
Fatu Saad
@fatensaadb
430.6K
9.0% ER

محمد زين
@themozain
425.3K
2.2% ER
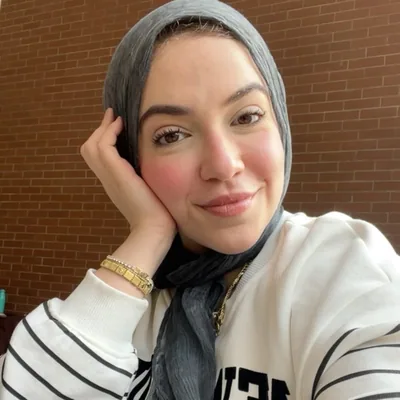
Nebal | نِبال
@yourbeautyfix__
415.5K
0.2% ER

Richa Etika Ulhaq 烏堤卡 🍉
@richaeu
381.2K
1.4% ER

owambeuk
@owambeuk
372.3K
0.0% ER
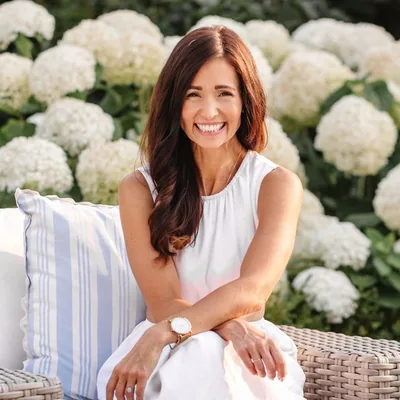
Fraîche Living : Tori Wesszer
@fraicheliving
372.3K
1.6% ER
YoungestStar🌟
@lil_yamme
360.9K
7.3% ER

Wayanadan (475 K Meta Family❤️)
@wayanadan
321.1K
1.3% ER
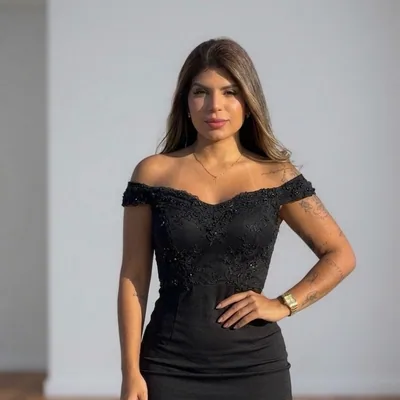
Valery Bujato
@valerybujato
307.8K
7.4% ER
Ahvianna Lee
@ahvileexo
296.8K
15.5% ER
This is just the top of the list — millions of profiles across several social networks
Sign up free to browse the full segment, filter by size, engagement and location, and export shortlists.
Unlock the full list — free
instme Top Business Bloggers — ranked live
About the business bloggers space
Business bloggers turn abstract decisions into usable frameworks
Business bloggers are distinct from lifestyle or entertainment creators because their value is usually practical: they translate markets, management, finance, productivity, entrepreneurship, sales, hiring, and workplace strategy into content an audience can apply. The segment includes startup commentators, solo-founder diarists, leadership writers, small-business educators, B2B marketing analysts, finance-for-operators creators, and career-focused business voices.
On Instagram, the format often appears as carousels, short caption-led analysis, founder lessons, quote breakdowns, and infographic-style posts. On TikTok, creators tend to use direct-to-camera explainers, business news reactions, “mistakes I made” stories, and tactical lists. YouTube gives more room for interviews, case studies, software walkthroughs, market commentary, and longer lessons on building or operating a company.
Audiences usually come for clarity rather than escapism. They want a faster way to understand a trend, compare tools, avoid common mistakes, or improve a professional skill. That makes trust, perceived expertise, and consistency more important here than visual polish alone.
Benchmark it against top business creators and top lifestyle bloggers, ranked from the same live index.
Partnerships work best when the offer fits a business problem
The strongest campaigns in this category are built around a concrete use case: saving time, improving reporting, getting leads, managing money, hiring better, launching a product, or learning a skill. A creator who can show how a product changes a workflow will usually be more persuasive than one who only announces a brand.
Common collaboration formats include sponsored explainers, tool tutorials, founder interviews, newsletter-style video recaps, carousel frameworks, webinar or event promotion, lead magnet distribution, and product comparisons. For software, financial services, education, professional services, and productivity brands, a “show the workflow” format often fits better than a broad lifestyle placement. For books, courses, conferences, and advisory offers, credibility and audience intent are especially important.
Performance is influenced by topic authority, audience seniority, platform format, production effort, exclusivity, usage rights, and whether the creator can create a persuasive business case. Follower count matters, but this segment often rewards niche authority: a smaller creator followed by founders, operators, marketers, or finance professionals can be more useful than a larger general-business account with passive attention.
Turn this research into results with our step-by-step guide to influencer marketing for startups.
Signals that separate credible business voices from recycled advice
Business content is easy to repackage, so evaluation should look beyond surface reach. Useful metrics include average engagement rate, saves, shares, comment quality, view consistency, audience geography, follower growth patterns, and the ratio of educational posts to promotional posts. The segment’s aggregate average follower count is 90,921, with an average engagement rate of 8.00%; verified accounts represent 34.9%. The size mix is weighted toward micro creators at 53%, followed by nano at 26%, mid at 17%, and macro at 5%, with no mega share in the provided mix.
Engagement quality matters more than raw size here because the audience is often looking for decisions, not distraction. Comments that ask implementation questions, challenge assumptions, or mention business contexts can indicate real professional attention. Saves and shares are especially relevant for frameworks, templates, checklists, and market explainers.
Red flags include generic motivational posts with little original analysis, exaggerated income claims, undisclosed affiliate-heavy content, sudden engagement spikes, repeated AI-like listicles, and advice that does not match the creator’s stated experience. Also check whether the creator can discuss trade-offs; credible business bloggers usually acknowledge context instead of presenting every tactic as universal.
Current trends include founder-led storytelling, transparent build-in-public updates, short market briefings, AI workflow tutorials, operator-focused templates, and more direct comparisons of tools and strategies. InstMe can help compare these signals across Instagram, YouTube, and TikTok without treating all business audiences as the same.
You don't have to check these by hand: InstMe's influencer discovery platform bakes them into every free report.
Market snapshot
How this segment breaks down by account size and platform — updated Sep 19, 2026.