
Top Travel Influencers
InstMe keeps a live ranking of travel influencers across platforms, drawn from an index of millions of profiles across several social networks. The typical account here averages 167.2K followers with a 11.26% engagement rate — real numbers from our monitoring pipeline, not a directory that quietly goes stale.
One thing worth knowing before you scroll: 75% of the creators in this segment are nano or micro accounts (under 100K followers), the tier where engagement runs warmest and collaborations cost the least. Shortlist a few names below, then open any profile for its full free report: growth trend, audience quality, benchmarks and estimated media value.
Millions
Profiles indexed across networks
167.2K
Avg. followers
11.26%
Avg. engagement
74%
Recently active
41.8%
Verified accounts
Top 21 creators
Ranked by followers

National Geographic Travel
@natgeotravel
45.5M
0.0% ER

Channing Tatum
@channingtatum
17.2M
2.7% ER

National Geographic Animals
@natgeoanimals
15.2M
0.8% ER

5202
@duki
13.4M
5.9% ER

Jen Selter
@jenselter
13.3M
0.0% ER

GUESS
@guess
8.6M
0.1% ER

Joe Hattab
@joe_hattab
7M
4.4% ER

Travel + Leisure
@travelandleisure
6.5M
0.0% ER

Samsung India
@samsungindia
6.1M
0.1% ER

Ligue 1 McDonald’s
@ligue1mcdonalds
6M
0.2% ER

Red Bull Brasil 🇧🇷
@redbullbr
4.8M
1.7% ER
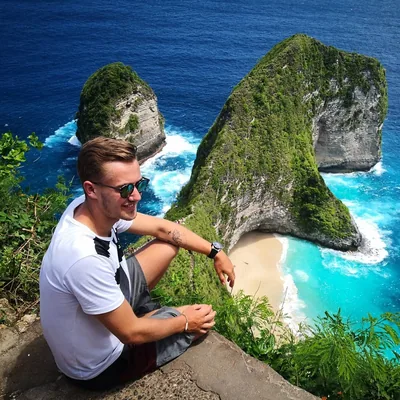
Max Haase - German Travel Influencer 🇩🇪
@_maxhaase_
4.3M
1.3% ER

Julia Gal
@juliagal_
3.8M
26.0% ER

Kimberly Ryder
@kimbrlyryder
3.5M
0.0% ER

Electronic Arts (EA)
@ea
3.2M
1.8% ER

The Bucket List Family
@thebucketlistfamily
3.2M
2.1% ER

Sephora Brasil
@sephorabrasil
3.2M
0.0% ER

Hollywood Reporter
@hollywoodreporter
3.1M
0.4% ER
Aurélie Bouti
@aureliestory
3M
100.0% ER

VOYAGED by 9GAG
@voyaged
3M
0.2% ER

Luxury Travel Community
@luxuryworldtraveler
2.9M
0.0% ER
This is just the top of the list — millions of profiles across several social networks
Sign up free to browse the full segment, filter by size, engagement and location, and export shortlists.
Unlock the full list — free
instme Top Travel Influencers — ranked live
About the travel influencers space
From airport walkthroughs to slow-travel diaries
A creator steps off an overnight train, shows the station at sunrise, cuts to a street breakfast, then overlays the exact route, fare class, and what they would book differently next time. That mix of atmosphere and practical detail is central to travel content on Instagram, YouTube, and TikTok.
Travel influencers cover a wide range of sub-genres: luxury hotels, budget backpacking, family trips, solo female travel, food-led itineraries, adventure travel, cruises, road trips, digital-nomad routines, destination weddings, aviation, rail travel, and local “hidden gems.” Some creators build around a geography, such as Japan travel or Mediterranean islands. Others build around a travel style, such as points-and-miles planning, minimalist packing, or accessible travel.
Formats vary by platform. Short vertical videos often focus on quick discovery: a viewpoint, a hotel room tour, a border-crossing tip, or a three-day itinerary. Instagram carousels are useful for saveable lists and maps. YouTube supports longer trip reports, destination guides, and comparison videos. Audiences come for inspiration, but they stay for specificity: how to get there, what it costs relative to alternatives, what to avoid, and whether the experience matches the images.
Benchmark it against top influencers and top music influencers, ranked from the same live index.
Partnerships that fit naturally into the trip
Travel campaigns work best when the product or destination has a clear role in the journey. Hotels, tourism boards, airlines, luggage brands, booking platforms, travel insurance providers, clothing labels, camera gear companies, and local tour operators can all fit, but the integration needs to feel useful rather than inserted.
Common formats include hosted stays, itinerary takeovers, “48 hours in” guides, packing lists, room or cabin tours, restaurant trails, activity reviews, and post-trip recap videos. For service brands, creators can document the booking process, check-in experience, claims process, loyalty benefit, or app feature in context. For destinations, content usually performs better when it balances scenic footage with practical planning details, such as seasonality, transport, crowd levels, and neighborhood recommendations.
Performance is often tied to intent. A beautiful clip can create awareness; a detailed itinerary can drive saves, shares, search traffic, and later consideration. Price-driving factors include audience geography, platform mix, production quality, travel complexity, usage rights, exclusivity, number of deliverables, turnaround time, and whether the creator must arrange professional shooting, drone footage, or multi-location coverage. Verified status may also affect demand; in the aggregate stats provided for this segment, 44.4% of profiles are verified. Still, a clear niche and strong audience trust can matter more than a badge.
Turn this research into results with our step-by-step guide to influencer marketing for travel brands.
Signals that separate useful reach from postcard metrics
Travel accounts often look strong at first glance because the visuals are inherently attractive. Deeper evaluation should focus on whether the audience acts on the content. Saves, shares, comments with planning questions, link clicks where available, repeat views, and completion rates on itinerary videos can be more informative than likes alone. The supplied aggregate data shows an average engagement rate of 8.13% and average followers of 268,677, but individual fit should be judged against the creator’s niche, audience location, and content format.
Engagement versus size is especially important in travel. The account-size mix for this segment is weighted toward micro creators at 54%, followed by nano creators at 21%, mid at 18%, mega at 4%, and macro at 3%. Smaller creators may offer focused communities around a destination or travel style. Larger creators can help with broad destination visibility, but their audience may be more dispersed and less immediately bookable.
Red flags include heavy reliance on reposted footage, vague captions with little firsthand detail, inconsistent location disclosure, engagement that does not match view patterns, repetitive hotel-only content, and comment sections filled with generic praise rather than travel questions. Brands should also check whether the creator distinguishes sponsored trips from personal recommendations.
Current trends favor searchable, practical content: map-style carousels, cost breakdowns, honest “what I’d skip” posts, shoulder-season guides, train and slow-travel routes, carry-on packing systems, and short videos built around one clear decision. InstMe can help compare these signals across Instagram, YouTube, and TikTok without treating follower count as the main proxy for quality.
You don't have to check these by hand: InstMe's influencer discovery platform bakes them into every free report.
Market snapshot
How this segment breaks down by account size and platform — updated Sep 19, 2026.