
Top Travel UGC Creators
This is InstMe's live ranking of travel ugc creators: creators measured on audience size, engagement and posting activity, surfaced from an index of millions of profiles across several social networks. Averages for the segment right now: 51.8K followers and 25.50% engagement.
Brands usually start at the top of the list, but the best opportunities often hide a little deeper — smaller creators here out-engage the big accounts more often than not. Open any profile for its full free report, or create a free account to search, filter and export the entire segment.
Millions
Profiles indexed across networks
51.8K
Avg. followers
25.50%
Avg. engagement
78%
Recently active
26.9%
Verified accounts
Top 21 creators
Ranked by followers

JARO | Travel Creator | UGC & Personal Brand Coaching
@travelwithjaro
1.4M
0.3% ER
Tanya Freedland
@therealsunsetchaser
524.7K
3.3% ER
Himanshu Sharma
@himachoman
384.3K
21.1% ER
Jo
@travelwithjofaccin
287K
0.5% ER

Jenni ☼ travel & hotel content creator
@worldtravelfox
163.1K
26.3% ER

MELANIE | TRAVEL CREATOR
@melalovel
158.2K
13.0% ER
Katya | Travel Content Creator & UGC ✈️
@katyawanders
140.4K
0.4% ER
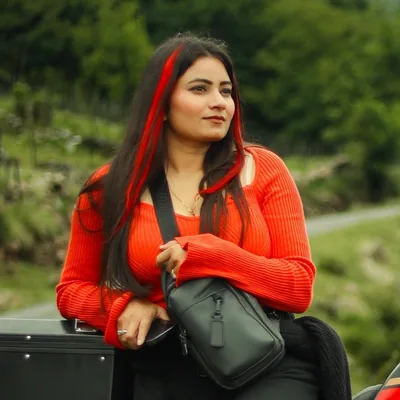
Anu Sharma | Travel Creator
@safarnamawithanu
135.6K
18.8% ER

☆𝓨𝓪𝓼𝓶𝓲𝓷𝓮 ☆
@emubreathesinpages
130K
18.3% ER
Smartphone Fotografi
@hptografi
129.3K
1.9% ER
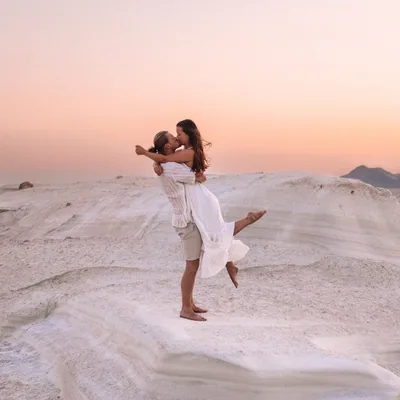
SAM & THOMAS | TRAVEL COUPLE | PHOTOGRAPHERS
@reispackers
87.8K
13.4% ER

Yenni
@theonlyyennii
82.3K
0.8% ER
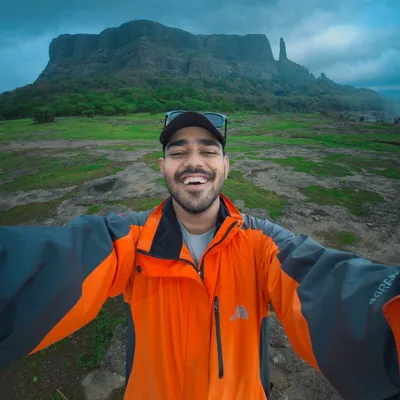
Rishi 🔸 Travel Photography/Cinematography
@silent.monk_
67.4K
46.2% ER
Kate Goodwin | Content Creator
@kate_in_london_
56.9K
5.8% ER

Amelia Wheatcroft-Brown
@ameliaspassport
52.2K
85.2% ER

Kelly
@simplysweethome__
48K
1.9% ER

Vy | Travel Tips & UGC Creator 🦭🌴
@vywherenext
41K
4.5% ER
Gunjan sood🦋 Travel UGC Creator📍LONDON (UK)🧿
@gunjansoodofficial
40K
18.8% ER
Sunanda Dhar
@travel_the__worldlady
38.7K
1.7% ER
Maddy | Outdoor & Travel UGC Coach
@maddyoutdoors.coach
38.1K
5.2% ER
Rida 🌸 | Explore with Chicago Girl
@explorewithchicagogirl__
37.8K
1.4% ER
This is just the top of the list — millions of profiles across several social networks
Sign up free to browse the full segment, filter by size, engagement and location, and export shortlists.
Unlock the full list — free
instme Top Travel UGC Creators — ranked live
About the travel ugc creators space
Travel UGC viewers want proof, not postcards
Viewers of travel UGC usually want to see what a trip feels like before they book: the walk from the hotel lobby to the beach, the size of the room, how crowded a viewpoint is, what the breakfast looks like, or whether a tour feels rushed. This makes the segment more practical than aspirational travel influencing, even when the footage is polished.
Common sub-genres include hotel and resort walkthroughs, destination guides, packing and airport routines, tour and activity recaps, cruise content, family travel, solo travel, food-led city itineraries, budget travel, luxury stays, and short-form “day in” travel diaries. Formats are often vertical videos for TikTok and Instagram Reels, carousel-style photo sets on Instagram, Shorts on YouTube, and longer YouTube edits for itineraries or property reviews.
Typical creator archetypes include frequent weekend travelers, digital nomads, couples documenting trips, parents showing family logistics, local destination specialists, and creators who produce UGC without positioning themselves as public-facing influencers. Audiences come for specificity: room noise, transportation time, accessibility, hidden fees, weather reality, and whether the experience matches the marketing images.
See how it stacks up next to top travel creators and top lifestyle ugc creators before you shortlist.
The strongest travel briefs turn trips into usable decision content
Travel audiences respond to content that helps them imagine the exact purchase decision: where to stay, what to do first, how to move around, and what is worth skipping. For marketers, that means the most useful collaborations are often built around experience-based assets rather than broad destination awareness.
Effective formats include first-person hotel tours, “three things to know before you go” clips, itinerary videos, UGC ads with voiceover, testimonial-style room or activity reviews, creator-shot B-roll packages, packing-to-arrival storylines, and edited variations for paid social. On Instagram and TikTok, quick hooks and clear visual proof tend to matter; on YouTube, pacing, detail, and search-friendly structure can be more important.
Performance usually improves when the creator can show the product naturally in context: checking in, using the amenity, joining the tour, ordering at the restaurant, or navigating the destination. Overly scripted praise can feel less credible in travel because viewers are actively looking for trade-offs.
Pricing is shaped by production demands, travel requirements, usage rights, exclusivity, turnaround time, number of deliverables, edit variations, voiceover, licensing for paid ads, and whether the creator must appear on camera. A creator who can shoot stable footage, capture ambient details, follow a brief, and deliver raw assets may be more valuable than one with a larger audience but weaker production discipline.
For briefs, pricing benchmarks and outreach templates, read our guide to influencer marketing for travel brands.
Signals that separate useful travel UGC from scenic filler
Viewers reward travel content that answers unspoken questions: Is this place easy to reach? Does it look the same outside golden hour? Is the experience suitable for couples, families, solo travelers, or first-time visitors? Marketers should read performance through that lens instead of judging only by polished visuals.
In this segment, the average follower count is 24,724 and the average engagement rate is 6.11%, with a verified share of 17.6%. The account-size mix is concentrated in nano and micro creators, each representing 47% of the segment, with mid-sized accounts at 6%. That makes engagement quality, audience fit, and content usability especially important. A smaller creator who consistently gets saves, comments with planning questions, shares, and destination-specific replies can be more relevant than a larger account with passive likes.
Useful metrics include view retention on short-form video, saves on itineraries, comment substance, audience geography, follower authenticity, posting consistency, and examples of past brand deliverables. For UGC-only work, also review production quality: framing, audio, transitions, lighting, caption clarity, and whether the creator can deliver multiple hooks and aspect ratios.
Red flags include repeated generic footage, unrealistic edits that hide practical details, engagement pods, comments that do not match the audience or language, undeclared sponsored content, inconsistent travel access, or portfolios made mostly from stock-like clips. Current trends favor candid POV footage, honest “worth it or not” framing, mini-itineraries, price-conscious travel planning without invented savings claims, and content that shows the full experience from arrival to departure.
Skip the manual checks — InstMe's influencer search platform surfaces these signals automatically in every free report.
Market snapshot
How this segment breaks down by account size and platform — updated Sep 19, 2026.