
Top Creators in Boston
InstMe keeps a live ranking of creators in Boston across platforms, drawn from an index of millions of profiles across several social networks. The typical account here averages 169.4K followers with a 13.97% engagement rate — real numbers from our monitoring pipeline, not a directory that quietly goes stale.
One thing worth knowing before you scroll: 78% of the creators in this segment are nano or micro accounts (under 100K followers), the tier where engagement runs warmest and collaborations cost the least. Shortlist a few names below, then open any profile for its full free report: growth trend, audience quality, benchmarks and estimated media value.
Millions
Profiles indexed across networks
169.4K
Avg. followers
13.97%
Avg. engagement
67%
Recently active
42.2%
Verified accounts
Top 21 creators
Ranked by followers

Holly Nichols
@hnicholsillustration
3M
0.9% ER
Jenn Lueke
@jenneatsgoood
1.7M
0.5% ER

Jamad🇸🇴
@_jamaaad
1.3M
2.1% ER
RUHAMA SHITRIT
@ruhamasfood
1.2M
1.6% ER
Adão Rosa
@adaorosatattoo
1M
2.4% ER
Pasta
@davidpastrnak
763.7K
9.4% ER
Jon Streeks
@jonthrifts
670.8K
0.3% ER
Preet Kaur
@preetkaurstudio
512.9K
0.1% ER
Maggie
@everydaymaggie
490.4K
0.8% ER
Joe Fenti
@fentifriedchicken
471.4K
20.3% ER
Carson Curran
@carsoncurran_
260.2K
0.8% ER
Max Loeb
@loebsleads
101K
1.5% ER

Boston Children’s Hospital
@bostonchildrens
100.5K
0.5% ER
Courtney Cox Dettore
@cococox
76.7K
1.9% ER

Ramsay's Kitchen
@ramsayskitchen
69.5K
5.0% ER
Kasya
@realkasya
61.3K
0.4% ER
SH*T THAT I KNIT
@heychristinapardy
59.7K
20.4% ER
Penny Kmitt
@pennylikeacoin
59K
27.0% ER

Monicki | مانیکی
@imonicki
54.1K
12.9% ER

Elizabeth
@elizabethmaclay
44.5K
0.0% ER

Boujee leek
@boujeeleek
33.6K
0.3% ER
This is just the top of the list — millions of profiles across several social networks
Sign up free to browse the full segment, filter by size, engagement and location, and export shortlists.
Unlock the full list — free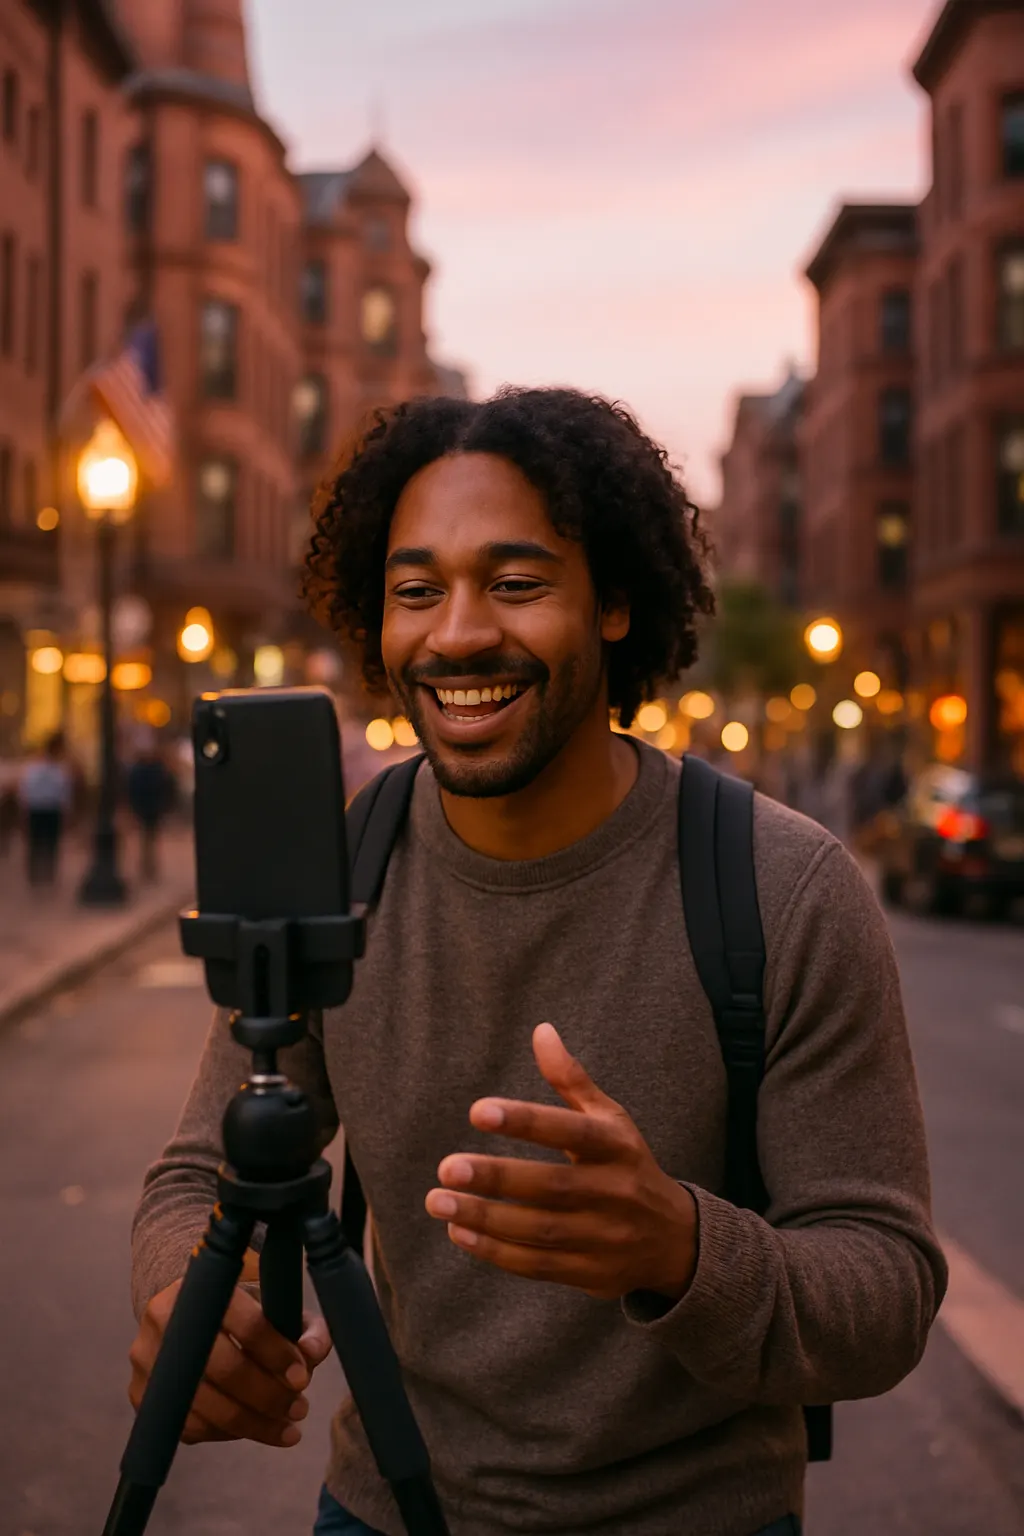
instme Top Creators in Boston — ranked live
About Creators in Boston
Boston content starts at street level
A creator films a rainy walk from the T to a North End bakery, cuts to the pastry case, then overlays a short note on the best time to avoid the line. That kind of practical, local-first storytelling is central to Boston creator content. It is less about polished city branding and more about navigating dense neighborhoods, seasonal weather, student life, food runs, events, apartments, fitness routes, and weekend plans.
Common sub-genres include restaurant and café discovery, neighborhood guides, college and post-grad lifestyle, sports-adjacent fan culture, running and wellness, fashion in a four-season climate, nightlife, family activities, and history-led city explainers. Formats vary by platform: quick TikTok recommendations, Instagram Reels and carousels for saved itineraries, and longer YouTube videos for moving guides, day trips, campus perspectives, or deeper reviews.
Audience intent is usually practical. Viewers want to know where to go, what to order, how to get there, whether a place is worth the wait, and which local experiences feel current rather than tourist-generic.
See how it stacks up next to top creators in the USA and top creators on Instagram in Boston before you shortlist.
Local campaigns that fit Boston behavior
Strong partnerships usually give the creator a reason to show the city in use. A restaurant launch can become a neighborhood date-night route. A retail opening can be framed around a commute, a weekend errand loop, or a student budget. Event campaigns work best when the creator captures arrival, atmosphere, crowd cues, and a clear reason to attend, not just a poster-style announcement.
Short-form video tends to carry discovery, especially for food, events, and things-to-do content. Instagram carousels can perform well when the concept is saveable: “three stops near Back Bay,” “rainy-day plans,” or “where to take visitors.” YouTube is useful for higher-consideration categories such as housing, education, travel planning, fitness programs, or city guides.
Pricing is shaped by more than follower count. Factors include how concentrated the audience is in Boston or nearby markets, production quality, editing and voiceover skill, access to desirable locations, verified status, usage rights, exclusivity, posting schedule, and whether the creator can deliver multiple assets across Instagram, TikTok, and YouTube. Seasonal demand can also matter, especially around school calendars, tourism peaks, major local events, and holiday shopping.
For briefs, pricing benchmarks and outreach templates, read our guide to creator marketing for your business.
Signals that separate useful reach from city noise
Boston creators often combine small-community trust with broad city visibility, so size alone is a blunt measure. In the aggregate data available for this segment, average following is 208,299 and average engagement rate is 8.70%, with 46.5% verified. The account-size mix is heavily weighted toward nano and micro profiles: 43% nano and 36% micro, alongside 7% mid, 5% macro, and 9% mega. That mix makes it important to compare creators by campaign role, not by a single benchmark.
For local campaigns, prioritize audience geography, saves, shares, comment relevance, story interaction, and repeated evidence that followers act on recommendations. Comments such as “I went after your video” or questions about hours, transit, reservations, or pricing are more meaningful than generic praise. Engagement rate can be more valuable than scale when the campaign depends on foot traffic, RSVPs, or neighborhood credibility.
Red flags include sudden audience spikes, repetitive sponsored posts with little personal context, comment sections dominated by non-local accounts, unclear disclosure, and content that could be filmed in any city. Current trends favor concise neighborhood guides, POV street segments, budget-conscious lists, transit-aware itineraries, seasonal food coverage, and honest “is it worth it?” reviews that help audiences make a decision quickly.
Skip the manual checks — InstMe's influencer search platform surfaces these signals automatically in every free report.
Market snapshot
How this segment breaks down by account size and platform — updated Sep 19, 2026.