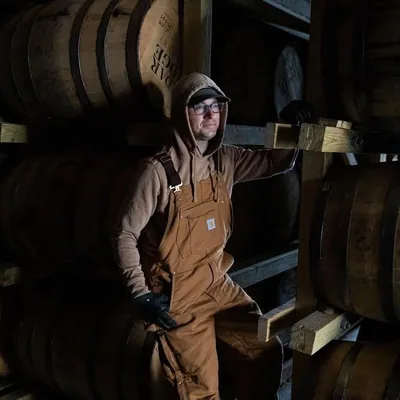
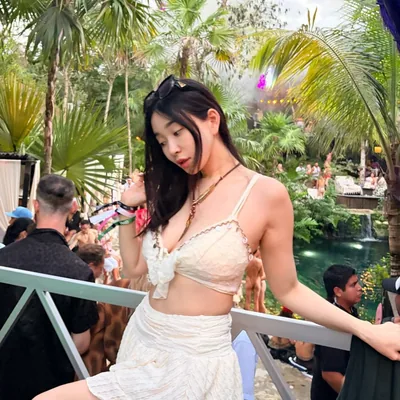
Day party 🍾 Every Saturday ( sometimes Sunday ) , Doors open at 2pm Rain ☔️ or shine ☀️ 📍 Riverside 5020 Rue St-Ambroise 💕 Dm for bottle service 🥃🍾
Outreach This Creator For FreeSummer of Jams runs an Instagram creator account with 7.5K followers on Instagram. To date Summer of Jams has posted 290 times, currently around 1 post a week. Posts average 144 likes and 20 comments, an engagement rate of 2.19%.
Summerofjams has built an audience of 7.5K followers on Instagram over 290 posts as a creator account.
Summerofjams's average post pulls 144 likes and 20 comments, roughly one interaction per 46 followers.
Roughly one in 7 likes comes with a comment, an unusually discussion-heavy audience.
Summerofjams maintains a rhythm of about one post per week.
Estimated sponsored-post value
$57–$110
Based on 7.5K followers and a 2.19% engagement rate, a single sponsored post by Summerofjams is worth an estimated $57–$110. This is a modeled range, not a quoted rate, actual pricing varies by niche, content format, usage rights and exclusivity.
| Metric | Summerofjams | Cohort median |
|---|---|---|
| Engagement rate | 2.19% | 5.05% |
| Average likes | 144 | 127 |
| Average comments | 20 | 12 |
| Posts per week | 1.34 | 0.26 |
Median values from 177,679 accounts with 1K–10K followers in the InstME index, refreshed Jul 19, 2026.
Get advanced audience quality signals, growth trend analytics, historical snapshots, and top-performing content patterns.
No credit card needed
Last reviewed: Jul 12, 2026
Summer of Jams is a Instagram creator on Instagram, with 7.5K followers.
Summer of Jams posts on Instagram as @summerofjams.
Summer of Jams has 7,491 followers on Instagram (7.5K) as of Jul 12, 2026.
Summer of Jams's engagement rate is 2.19%, calculated from average likes and comments per post relative to followers.
Posts by Summer of Jams average 144 likes and 20 comments.
Summer of Jams posts about 1 time per week on average.
Summer of Jams is registered as a creator account on Instagram.
A sponsored post from Summer of Jams is estimated at $57 to $110. This is a model based on audience size and engagement, not a rate card, so real pricing is set by the creator.
Total Posts
290
Avg Comments
20
Engagement
3.13%