
Top Creators on Instagram in New York
InstMe keeps a live ranking of creators on Instagram in New York on Instagram, drawn from an index of millions of profiles across several social networks. The typical account here averages 95.6K followers with a 11.91% engagement rate — real numbers from our monitoring pipeline, not a directory that quietly goes stale.
One thing worth knowing before you scroll: 86% of the creators in this segment are nano or micro accounts (under 100K followers), the tier where engagement runs warmest and collaborations cost the least. Shortlist a few names below, then open any profile for its full free report: growth trend, audience quality, benchmarks and estimated media value.
Millions
Profiles indexed across networks
95.6K
Avg. followers
11.91%
Avg. engagement
69%
Recently active
33.0%
Verified accounts
Top 21 creators
Ranked by followers
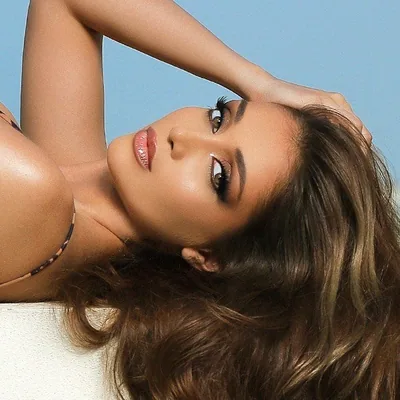
Elnaz Golrokh
@elnaz_golrokh
10.2M
0.9% ER

A N G E L A N I K O L A U
@angela_nikolau
4.8M
32.8% ER
Nick Kosir
@nickkosir
2.9M
5.6% ER

KING 👑 STAKZ
@djstakz
2.7M
0.0% ER
Evelyn 현정 Ha
@hjevelyn
2.4M
4.5% ER
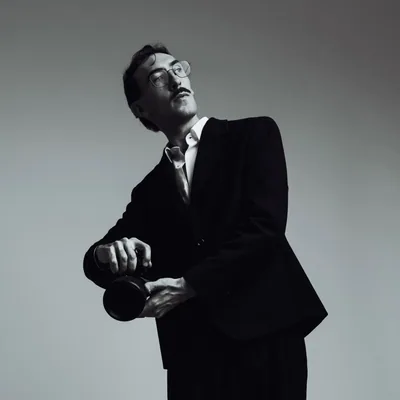
Brandon Woelfel
@brandonwoelfel
2.1M
0.2% ER

preston rakovsky
@prestonrack
1.9M
5.2% ER
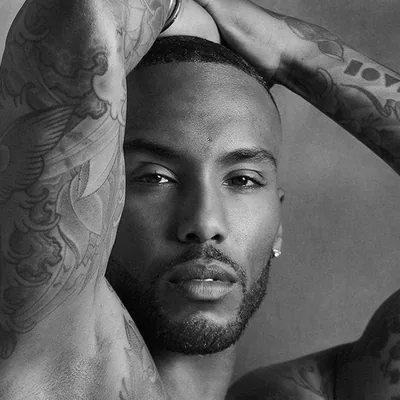
Joseph David
@justjosephd
1.7M
5.2% ER
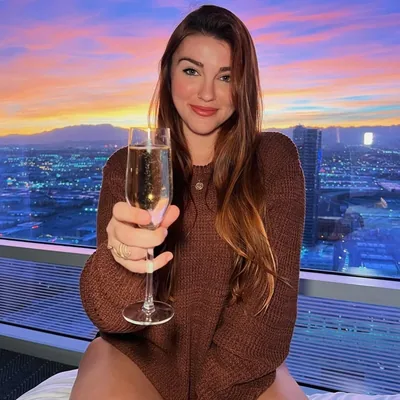
Karissa Dumbacher
@karissadumbacher
1.6M
5.1% ER

Royal Gale
@royal.g
1.5M
1.6% ER
Dr. Tim Tiutan | Internal Medicine
@doctortim.md
1.5M
0.4% ER

Alwina Kuhn
@alwina_kuhn
1.5M
0.7% ER
Sarah Fennel
@bromabakery
1.5M
1.0% ER
Ana Luiza Luizi & Júnio Enrique 💃🏻🕺🏻
@thatbraziliancouple
1.4M
2.5% ER
Magnus The Therapy Dog
@magnusthetherapydog
1.4M
28.7% ER
Jordan Rand
@jordan_rand
1.3M
9.5% ER
Lindsey Rowley
@linsmakeuplooks
1.2M
2.0% ER

Alaire Thomas
@alairethomas
1.1M
6.5% ER
Jeffrey Harnish
@jeffrey_in_nyc
1.1M
1.9% ER

Dr. David Kim
@dr.david.kim
1.1M
1.7% ER
Jooli Lee
@jumybear
1M
2.7% ER
This is just the top of the list — millions of profiles across several social networks
Sign up free to browse the full segment, filter by size, engagement and location, and export shortlists.
Unlock the full list — free
instme Top Creators on Instagram in New York — ranked live
About Creators on Instagram in New York
Street-level New York, filtered through Instagram
A carousel might start with a rainy crosswalk in SoHo, move to a close-up of a bodega sandwich, then end with a rooftop outfit shot at dusk. That range is typical of New York Instagram creators: fast, visual, and closely tied to neighborhoods, routines, and access.
This segment includes fashion and streetwear accounts, food reviewers, nightlife and event creators, fitness instructors, beauty and grooming voices, photographers, neighborhood guides, apartment and interiors creators, comedians, and lifestyle personalities who turn daily movement through the city into content. Some are polished editorial creators with professional photography; others are iPhone-first documentarians who post Reels from the subway, cafés, pop-ups, parks, galleries, and small businesses.
Audiences usually come for discovery and judgment. They want to know where to eat, what to wear, which events feel worth attending, how a product looks in a real city setting, or how a New York routine is actually lived. For many creators, credibility comes from specificity: naming the neighborhood, showing the line outside the venue, comparing options, or explaining why something is worth the trip.
See how it stacks up next to top creators on Instagram before you shortlist.
Partnerships that fit the pace of the city feed
New York Instagram campaigns often work best when the creator can place the brand inside an actual routine rather than presenting it as a detached endorsement. A fashion creator may style a jacket across a day of errands and dinner. A food creator may document a tasting, a delivery order, or a neighborhood guide. A fitness creator may connect apparel, recovery, or nutrition to a class schedule. For local venues, Reels, Stories, and saveable carousel guides are especially useful because audiences can act quickly.
Strong formats include short-form Reels with clear visual payoff, Story sequences with location tags and links, carousel recommendations, launch-event attendance, product seeding followed by authentic usage, and creator-hosted experiences. Content tends to perform when it feels timely, practical, and easy to share: a new opening, a limited drop, a seasonal activity, or a concise comparison between options.
Pricing is usually shaped by audience quality, production level, category authority, usage rights, exclusivity, location access, timeline, and whether the creator is expected to attend, shoot, edit, and post across multiple placements. Verified status can matter for perception, but it should not replace fit. In this segment, neighborhood relevance and visual consistency often influence value as much as follower count.
For briefs, pricing benchmarks and outreach templates, read our guide to creator marketing for your business.
Signals that separate local influence from surface reach
The account-size mix is weighted toward smaller creators: nano accounts represent 56% of the segment and micro accounts 32%, while mid accounts are 8%, macro accounts 2%, and mega accounts 2%. That makes engagement quality especially important. The aggregate average is 82,469 followers and an 11.47% engagement rate, with 31.3% verified, but averages should be treated as context rather than a pass-fail benchmark.
Look closely at who is engaging. Useful comments mention places, questions, purchases, reservations, outfit details, or requests for recommendations. Weak signals include generic praise repeated across posts, sudden spikes disconnected from the content, or audiences that appear unrelated to New York. Saves and shares are particularly meaningful for food, events, shopping, fitness, and neighborhood content because they show intent beyond a quick like.
Review recent Reels and carousels, not just the best-performing posts. Check whether the creator still posts from New York consistently, whether branded content blends with organic work, and whether Stories show real day-to-day audience interaction. Red flags include over-tagged captions, unclear disclosures, repetitive sponsored scripts, inflated-looking comment sections, or content that claims local expertise while offering little location detail.
Current trends favor short neighborhood guides, candid street-style clips, “day in the life” edits, small-business discovery, event previews, behind-the-scenes access, and highly specific recommendations. For marketers using InstMe, the strongest shortlist usually balances measurable engagement with evidence that the creator can move attention toward a real place, product, or action.
Skip the manual checks — InstMe's influencer search platform surfaces these signals automatically in every free report.
Market snapshot
How this segment breaks down by account size — updated Sep 19, 2026.